Consumer Market Outlook
Real-money prediction-market odds on the prices that hit your wallet — inflation, gas, airfare, used cars, groceries, housing, retail sales, tariffs and recession risk.
All odds come from the Kalshi public API (no account or API key required).
Odds are the market-implied chance of each outcome, sourced from Kalshi's public free market data and refreshed about twice a day. Last updated Mon, 14 Sep 2026 18:16:27 GMT. Informational only — not financial advice.
Headline inflation (CPI)
Traders' odds on where year-over-year US consumer price inflation lands.
Will the rate of CPI inflation be above 3.4% for the year ending in September 2026?
75%Market closes Oct 14, 2026
Will the rate of CPI inflation be above 3.2% for the year ending in September 2026?
96%Market closes Oct 14, 2026
Will the rate of CPI inflation be above 3.7% for the year ending in September 2026?
19%Market closes Oct 14, 2026
Will the rate of CPI inflation be above 3.6% for the year ending in September 2026?
26%Market closes Oct 14, 2026
Will the rate of CPI inflation be above 3.5% for the year ending in September 2026?
55%Market closes Oct 14, 2026
What it means for shoppers: Hotter inflation means list prices keep climbing, so coupon codes and percent-off deals are worth more in real dollars.
Core inflation
Inflation excluding food and energy — the trend retailers price against.
Will the rate of core CPI inflation be above 2.1% for the year ending in August 2026?
97%Market closes Sep 11, 2026
Will the rate of core CPI inflation be above 2.7% for the year ending in August 2026?
1%Market closes Sep 11, 2026
Will the rate of core CPI inflation be above 2.9% for the year ending in August 2026?
13%Market closes Sep 11, 2026
Will the rate of core CPI inflation be above 3.0% for the year ending in August 2026?
1%Market closes Sep 11, 2026
CPI core year-over-year in Aug 2026?
29%Market closes Sep 11, 2026
What it means for shoppers: Sticky core inflation usually means fewer deep everyday markdowns and more short, event-driven sales.
Gas prices
Odds on the US average price of regular gasoline.
Will average gas prices be above $4.09?
1%Market closes Aug 31, 2026
Will average gas prices be above $4.08?
12%Market closes Aug 31, 2026
Will average gas prices be above $4.06?
100%Market closes Aug 31, 2026
Will average gas prices be above $4.07?
93%Market closes Aug 31, 2026
Will average gas prices be above $4.10?
1%Market closes Aug 31, 2026
What it means for shoppers: Cheaper gas frees up household budgets and tends to lift discretionary retail spending; expensive gas pushes shoppers to online orders with free shipping.
Airfare outlook
Market odds on the BLS airline fares index.
Will Consumer Price Index for All Urban Consumers: Airline Fares in U.S. City Average for July 2026 be above 312?
74%Market closes Aug 12, 2026
Will Consumer Price Index for All Urban Consumers: Airline Fares in U.S. City Average for July 2026 be above 310?
90%Market closes Aug 12, 2026
Will Consumer Price Index for All Urban Consumers: Airline Fares in U.S. City Average for July 2026 be above 311?
67%Market closes Aug 12, 2026
Will Consumer Price Index for All Urban Consumers: Airline Fares in U.S. City Average for July 2026 be above 313?
56%Market closes Aug 12, 2026
Will Consumer Price Index for All Urban Consumers: Airline Fares in U.S. City Average for July 2026 be above 307?
82%Market closes Aug 12, 2026
What it means for shoppers: Falling airfares are a signal to book travel deals early; rising fares mean hotel and package coupons matter more.
Used-car prices
Odds on the used cars and trucks CPI print.
Will US used cars and trucks CPI for July 2026 be above 179.50 ?
78%Market closes Aug 12, 2026
Will US used cars and trucks CPI for July 2026 be above 180.50?
31%Market closes Aug 12, 2026
Will US used cars and trucks CPI for July 2026 be above 180.25 ?
33%Market closes Aug 12, 2026
Will US used cars and trucks CPI for July 2026 be above 179.25 ?
89%Market closes Aug 12, 2026
Will US used cars and trucks CPI for July 2026 be above 180.75?
18%Market closes Aug 12, 2026
What it means for shoppers: Softening used-car prices free up big-ticket budget and usually precede better auto-parts and accessory promos.
Housing & shelter costs
Shelter inflation and mortgage-rate markets.
Will any 2026 Freddie Mac Primary Mortgage Market Survey (PMMS) report a 30-Year Fixed-Rate Mortgage rate below 5.75%?
8%Market closes Dec 31, 2026
What it means for shoppers: Shelter is the biggest line in most budgets — when it cools, home goods and furniture discounting picks up.
Food & grocery prices
Grocery-basket markets, where they are trading.
Will the FAO Food Price Index for August 2026 be above 136.0?
4%Market closes Sep 4, 2026
Will the FAO Food Price Index for August 2026 be above 135.0?
5%Market closes Sep 4, 2026
Will the FAO Food Price Index for August 2026 be above 134.0?
6%Market closes Sep 4, 2026
Will the FAO Food Price Index for August 2026 be above 133.0?
10%Market closes Sep 4, 2026
Will the FAO Food Price Index for August 2026 be above 132.0?
20%Market closes Sep 4, 2026
What it means for shoppers: Grocery inflation is the fastest route to coupon-clipping behavior — expect heavier CPG and household-goods coupon usage.
Retail sales
Odds on month-over-month US retail sales growth.
Will United States retail sales MoM for July 2026 be above -0.4%?
84%Market closes Aug 14, 2026
Will United States retail sales MoM for July 2026 be above -0.2%?
63%Market closes Aug 14, 2026
Will United States retail sales MoM for July 2026 be above 0.0%?
46%Market closes Aug 14, 2026
Will United States retail sales MoM for July 2026 be above 0.4%?
21%Market closes Aug 14, 2026
Will United States retail sales MoM for July 2026 be above 1.0%?
5%Market closes Aug 14, 2026
What it means for shoppers: Weak retail sales force retailers to discount harder to clear inventory — historically the best window for shoppers.
Jobs & unemployment
Market odds on the US unemployment rate.
Unemployment rate in Aug 2026?
10%Market closes Sep 4, 2026
Unemployment rate in Aug 2026?
4%Market closes Sep 4, 2026
Unemployment rate in Aug 2026?
25%Market closes Sep 4, 2026
Unemployment rate in Aug 2026?
26%Market closes Sep 4, 2026
Unemployment rate in Aug 2026?
3%Market closes Sep 4, 2026
What it means for shoppers: Rising unemployment odds mean cautious shoppers and, eventually, deeper clearance events.
Tariffs
Odds on the effective US tariff rate on imported goods.
Will the US effective tariff rate (customs duties collected ÷ nominal imports of goods, represented by B235RC1Q027SBEA ÷ A255RC1Q027SBEA) for Q3 2026 be above 9%?
69%Market closes Oct 29, 2026
Will the US effective tariff rate (customs duties collected ÷ nominal imports of goods, represented by B235RC1Q027SBEA ÷ A255RC1Q027SBEA) for Q3 2026 be above 8%?
97%Market closes Oct 29, 2026
Will the US effective tariff rate (customs duties collected ÷ nominal imports of goods, represented by B235RC1Q027SBEA ÷ A255RC1Q027SBEA) for Q3 2026 be above 5%?
98%Market closes Oct 29, 2026
Will the US effective tariff rate (customs duties collected ÷ nominal imports of goods, represented by B235RC1Q027SBEA ÷ A255RC1Q027SBEA) for Q3 2026 be above 7%?
97%Market closes Oct 29, 2026
Will the US effective tariff rate (customs duties collected ÷ nominal imports of goods, represented by B235RC1Q027SBEA ÷ A255RC1Q027SBEA) for Q3 2026 be above 6%?
97%Market closes Oct 29, 2026
What it means for shoppers: Higher tariffs feed straight into imported electronics, apparel and home goods prices — buy ahead of increases.
Recession & economy
Market-implied odds of a recession.
Will the IMF declare a global recession before 2027?
13%Market closes Jan 1, 2027
When will the next U.S. recession start?
5%Market closes Dec 31, 2026
When will the next U.S. recession start?
6%Market closes Dec 31, 2026
When will the next U.S. recession start?
2%Market closes Dec 31, 2026
When will the next U.S. recession start?
2%Market closes Dec 31, 2026
What it means for shoppers: Recession odds are a leading indicator for promotional intensity — retailers discount early to defend traffic.
US Debt & Treasury Data
Official federal borrowing and interest-cost figures — the backdrop for consumer credit and retail discounting.
Total US national debt
$39.89 trillion
+7.8% vs a year ago
$32.14 trillion held by the public · $7.75 trillion intragovernmental
As of Aug 10, 2026
What it means for shoppers: A fast-growing debt load keeps upward pressure on interest rates, which filters into credit-card APRs and store financing offers. Paying with cash or a 0% promo beats carrying a balance on a discounted purchase.
National debt per person
$117,290
About $294,399 per household · based on 340 million US residents
As of Aug 10, 2026
What it means for shoppers: Every household's share of the debt is serviced through taxes and higher borrowing costs. It's a reminder that the real win on a purchase is the price you avoid financing, not just the discount.
Average interest rate on US debt
3.45%
+0.10 pts vs a year ago
Weighted average rate Treasury pays across all interest-bearing securities.
As of Jul 31, 2026
What it means for shoppers: This is the cleanest read on the government's cost of money. When it falls, consumer borrowing and retailer inventory financing get cheaper — historically a setup for more aggressive promotions.
Interest paid on the debt (fiscal YTD)
$1.17 trillion
Total interest expense so far this federal fiscal year (starts Oct 1).
As of Jul 31, 2026
What it means for shoppers: Rising interest costs crowd out other spending and keep rates elevated longer. For shoppers that means fewer 0% financing offers on big-ticket items — lean on coupon stacking instead.
Federal deficit (fiscal YTD)
$1.37 trillion
-23.0% vs the same point last year
June: $120.3 billion deficit for the month alone.
As of Jun 30, 2026
What it means for shoppers: Bigger deficits mean more Treasury borrowing, which competes with consumers for credit and keeps card and auto-loan rates high. Watch for retailers leaning on coupons instead of financing offers.
Federal spending vs revenue (fiscal YTD)
$5.52 trillion out
$4.15 trillion collected in taxes and fees · the government is spending about $1.33 for every $1 it takes in.
As of Jun 30, 2026
What it means for shoppers: Federal outlays land in household budgets as benefits, refunds and payrolls. When spending growth slows, discretionary retail cools first — and clearance racks fill up faster.
Treasury's cash balance
$966.9 billion
Treasury General Account — the federal government's checking account.
As of Aug 10, 2026
What it means for shoppers: A shrinking balance often precedes heavy Treasury borrowing, which drains liquidity from markets. It's an early warning that credit conditions — and retail promotions — may tighten.
Source: U.S. Department of the Treasury Fiscal Data API (free public data, no API key). Last updated Mon, 14 Sep 2026 18:16:28 GMT. Informational only — not financial advice.
Government Grants
Open federal funding opportunities from Grants.gov that touch household costs — energy, housing, food, education and small business.
Energy & utility assistance
495 openOpen federal funding tied to home energy, weatherization and utility bill help.
What it means for shoppers: Programs funded here usually flow to state and local agencies that pay part of your heating, cooling or weatherization costs.
Housing & rental help
477 openFederal opportunities supporting affordable housing and rental assistance.
What it means for shoppers: New housing awards often expand local rent, down-payment and home-repair assistance a few months later.
Food & nutrition
485 openGrants funding food security, nutrition and grocery-access programs.
What it means for shoppers: These fund food banks, produce vouchers and school meal programs — real grocery savings for qualifying households.
Small business & entrepreneurs
490 openFunding aimed at small businesses and local entrepreneurs.
What it means for shoppers: If you run a shop or side business, these are direct funding routes that beat any coupon.
Education & training
566 openGrants supporting education, workforce training and scholarships.
What it means for shoppers: Tuition and training costs are the biggest household expense after housing — these programs cut them directly.
Source: Grants.gov Search API (free public data, no API key). Last updated Mon, 14 Sep 2026 18:16:29 GMT. 9mallsAI.com is not affiliated with Grants.gov; informational only.
Recent Product Recalls
The most pressing consumer product recalls from the U.S. Consumer Product Safety Commission — 152 announced in the last 90 days.
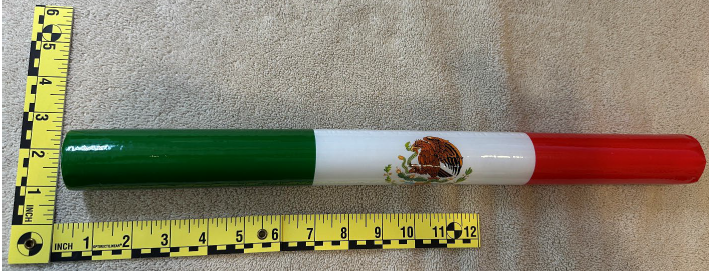
ZMC Group Expands Recall of Light-Up Children’s Toys Due to Risk of Serious Injury or Death from Battery Ingestion; Violate Mandatory Standard for Toys
The recalled light-up toys violate the mandatory safety standard for children’s toys because the toys contain button cell batteries that can be easily accessed by children. If button cell or coin batteries are swallowed, the ingested batteries can cause serious injuries, including internal chemical burns, and death.
Units: About 245,124 (ZMC Group previously recalled 124,560 battery-operated light up toys on May 07, 2026, which are included in the total of 245,124)

Victgoal Recalls Bicycle Helmets Due to Risk of Serious Injury or Death from Head Injury; Violate Mandatory Standard for Bicycle Helmets
The recalled helmets violate the mandatory safety standard for bicycle helmets because the helmets do not comply with the retention system, positional stability and certification requirements. The helmets can fail to protect the user in the event of a crash, posing a serious risk of injury or death due to head injury.
Units: About 40

Triumph Motorcycles Recalls Closed Course Competition Motorcycles Due to Risk of Serious Injury or Death from Crash Hazard
The engine rocker arm on the recalled motorcycles can seize or stick and the exhaust valves can remain open or break, posing a risk of serious injury or death from a crash hazard.
Units: About 1,560 (In addition, about 171 were sold in Canada)
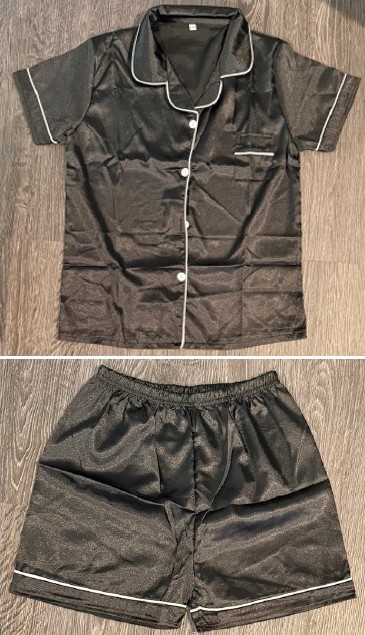
Sweet Cubby Recalls Children's Loungewear Sets Due to Risk of Serious Injury or Death from Burn Hazard; Violate Mandatory Standard for Children’s Sleepwear
The recalled children’s loungewear sets violate the mandatory flammability standard for children’s sleepwear, posing a risk of serious burn injuries or death.
Units: About 12,461
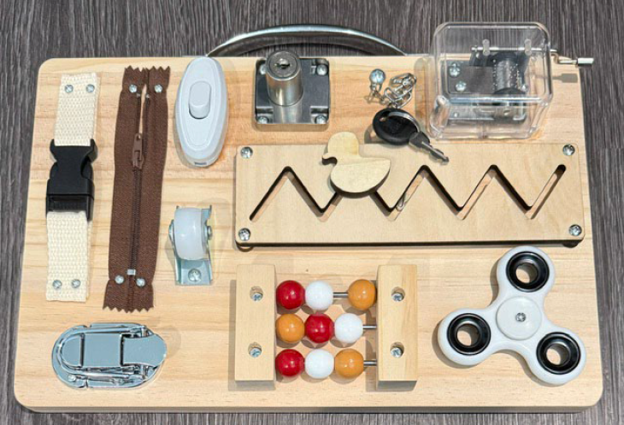
SQT Recalls Lontcs Busy Boards Due to Risk of Serious Injury from Lead Poisoning; Violate Federal Lead Paint Ban
The toys’ zipper contains levels of lead that exceed the standard set in the federal lead paint ban. Lead is toxic if ingested by young children and can cause adverse health issues.
Units: About 1,835

Ricky Joy Recalls More Than 2.3 Million Sour Crush Candy Bottles Due to Risk of Serious Injury or Death from Choking Hazard
The rolling ball on the recalled candy bottles can detach, posing a risk of serious injury or death from choking hazard.
Units: About 2.3 million
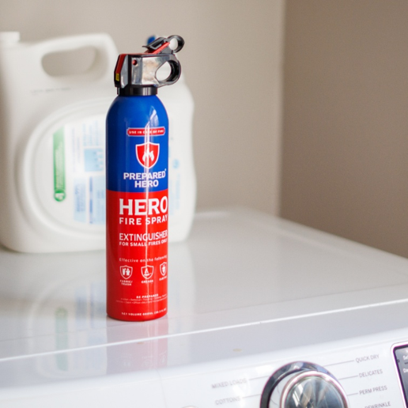
Prepared Hero Recalls Fire Spray Canisters Due to Risk of Serious Injury or Death from Fire and Burn Hazards
The recalled fire spray canister can deteriorate overtime, causing it to rupture and fail to operate during a fire, posing the risk of serious injury or death from fire and burn hazards.
Units: About 31,000
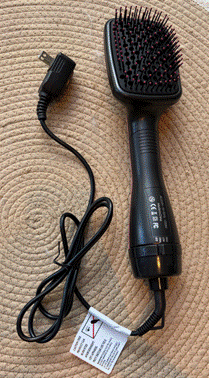
Junkins Recalls DHASUWT Hair Dryer Brushes Due to Risk of Serious Injury or Death from Electrocution, and Shock Hazards; Violate Federal Regulations; Smoking and Fire Hazards
The recalled hair dryer brushes lack an integrated immersion protection device, which presents a substantial product hazard to consumers, posing the risk of death or serious injury from electrocution or shock if the hair dryers fall into water while plugged in to an electrical source. The recalled hair dryer brushes...
Units: About 1,738
Source: CPSC Recalls API (free public data, no API key). Showing a short list of the most pressing recalls. Last updated Mon, 14 Sep 2026 18:16:30 GMT. 9mallsAI.com is not affiliated with the CPSC; informational only.
FDA Food Recalls
The most serious food recalls and enforcement reports from the U.S. Food & Drug Administration — 728 filed in the last 6 months.
Organic Moringa Powder; 15kg/bag (bulk); Product code: GJ96
Recalled by Green Jeeva LLC, CA
Moringa Powder ingredient positive for salmonella
Distribution: Product was distributed to 4 different consignees who have used the ingredient for further processing and distribution.
Modern Warrior Ready, Dietary Supplement, 60 CAPSULES
Recalled by Modern Warrior Life, LLC, AZ
FDA analysis revealed the presence of unapproved ingredients including tianeptine, 1,4 DMAA, and aniracetam.
Distribution: The recalled product was distributed to customers nationwide from April 2022 until December 8, 2025
1. TNVitamins 100% Organic Moringa Capsules 1,200 mg 2. TNVitamins 100% Organic Moringa Powder 96 grams
Recalled by Total Nutrition Inc, NY
Contaminated with Salmonella
Distribution: nationwide
Fusia, Asian Inspirations, Kimchi & Tofu Kimbap, 8.1 OZ (230 g), Paper Film Wrapper, 12 packages per case , 6 ea: Kimchi & Tofu Kimbap / 6 ea Spicy Tuna with Gochujang Kimbap, K...
Recalled by GELLERT GLOBAL GROUP, NJ
Undeclared Allergen (Fish)
Distribution: The adulterated product was distributed to the following states: NY, PA, CT, NC, TX, MD
Ice Pop, D'Dioses Nuez, 1 Bar (81.7 g), with UPC 827912008548
Recalled by D'Dioses Fruit Pops, Inc., NJ
May contain undeclared milk, pecans, pistachios, yellow #5 and red #40.
Distribution: Distributed in the following states: NJ, CT, NY, PA.
Ice Pop, D'Dioses Tamarindo, 1 Bar (81.7 g), with UPC 827912008593
Recalled by D'Dioses Fruit Pops, Inc., NJ
May contain undeclared milk, pecans, pistachios, yellow #5 and red #40.
Distribution: Distributed in the following states: NJ, CT, NY, PA.
Ice Pop, D'Dioses Arroz con Leche, 4 oz (85 g), with UPC 710594511843
Recalled by D'Dioses Fruit Pops, Inc., NJ
May contain undeclared milk, pecans, pistachios, yellow #5 and red #40.
Distribution: Distributed in the following states: NJ, CT, NY, PA.
Ice Pop, D'Dioses Fresa Leche, 4 oz (85 g), with UPC 710594511850
Recalled by D'Dioses Fruit Pops, Inc., NJ
May contain undeclared milk, pecans, pistachios, yellow #5 and red #40.
Distribution: Distributed in the following states: NJ, CT, NY, PA.
What it means for shoppers: Deep discounts on pantry, dairy and frozen items sometimes follow a recall cycle — check the lot codes on clearance food before you buy, and never eat a Class I recalled product.
Source: openFDA Food Enforcement API (free public data, no API key). Showing a short list of the most serious recalls. Last updated Sun, 09 Aug 2026 06:10:41 GMT. 9mallsAI.com is not affiliated with the FDA; informational only — openFDA data is not validated for medical decisions.
US Business Climate by State
Census Business Formation Statistics — new business applications, hiring intent and projected formations for August 2026.
Business applications (BA)
478,274
+11.4% vs a year ago
New business applications filed with the IRS nationwide this month.
What it means for shoppers: A rush of new businesses means more small sellers competing for your dollar — expect more launch discounts, first-order coupons and local promotions.
High-propensity applications (HBA)
131,083
+1.9% vs a year ago
Applications most likely to become real employer businesses.
What it means for shoppers: High-propensity filings are the ones that turn into actual storefronts and services. When they climb, expect real new options — and grand-opening deals — within a year.
Applications planning wages (WBA)
30,551
-14.8% vs a year ago
Applications that indicate the business plans to hire and pay wages.
What it means for shoppers: Planned-wage filings track hiring intent. More hiring means more household income locally, which usually firms up prices but improves service and selection.
Corporate applications (CBA)
36,829
-4.8% vs a year ago
Applications filed by corporations rather than sole proprietors.
What it means for shoppers: Corporate filings skew toward larger, better-capitalized entrants — the kind that run aggressive promotional campaigns to buy market share.
Projected business formations (8 quarters)
34,262
+10.1% vs a year ago
Applications projected to become employer businesses within eight quarters.
What it means for shoppers: This is the forward-looking read on real competition. Rising projections point to more choices — and more discounting — over the next two years.
Average formation duration
2.4 weeks
+0.0 weeks vs a year ago
Average time from application to becoming an employer business (within eight quarters).
What it means for shoppers: Shorter formation times mean new competitors reach the market faster, so the discounting that comes with new entrants shows up sooner.
Fastest-growing states
Biggest year-over-year jump in new business applications.
- Alaska1,241+69.1%
- Maine1,340+39.3%
- Vermont673+36.0%
- West Virginia1,569+32.0%
- Mississippi5,116+31.3%
- Colorado14,022+29.9%
- Idaho3,118+29.6%
- Kentucky6,217+28.9%
- Minnesota7,560+27.7%
- California50,293+25.9%
Most new businesses
States filing the most applications, with high-propensity filings.
- Florida55,60215,811 HBA
- California50,29315,564 HBA
- Texas43,52712,003 HBA
- New York23,7928,507 HBA
- Georgia20,2295,102 HBA
- North Carolina15,5784,315 HBA
- Illinois14,5434,427 HBA
- New Jersey14,3683,706 HBA
- Colorado14,0223,131 HBA
- Michigan13,2233,195 HBA
Slowest-growing states
Weakest year-over-year change in new business applications.
- Hawaii1,251-10.8%
- South Carolina7,567-7.4%
- District of Columbia1,171-2.3%
- North Carolina15,578-2.3%
- Delaware4,657-2.3%
- Nebraska1,797-2.1%
- Wisconsin5,543+0.7%
- Tennessee8,626+1.9%
- Maryland8,009+2.6%
- Pennsylvania12,648+4.5%
Least new businesses
States filing the fewest applications, with high-propensity filings.
- Vermont673204 HBA
- North Dakota792233 HBA
- Rhode Island1,001273 HBA
- South Dakota1,170288 HBA
- District of Columbia1,171330 HBA
- Alaska1,241207 HBA
- Hawaii1,251330 HBA
- Maine1,340422 HBA
- West Virginia1,569410 HBA
- New Hampshire1,588434 HBA
What it means for shoppers: States with a surge of new businesses tend to see the sharpest local competition — more grand-opening offers, first-order coupons and promo codes chasing early customers.
Source: U.S. Census Bureau Business Formation Statistics (free public data, no API key). Last updated Mon, 14 Sep 2026 18:16:31 GMT. 9mallsAI.com is not affiliated with the Census Bureau; informational only.
Tax Burden by State
Census State Government Tax Collections (2025) — total state taxes collected per resident, with income, sales, corporate and property breakdowns.
All states combined
$1535.8B
Total state tax collections nationwide.
National average per person
$4,474
State taxes collected per US resident, used as the ranking baseline.
Top 10 highest tax states
Most state tax collected per resident.
- #1District of Columbia$16,036/persontotal $11.3Bincome $3.6Bsales $2.1Bcorporate $1.2Bproperty $3.0B
- #2Vermont$8,028/persontotal $5.2Bincome $1.4Bsales $618.1Mcorporate $286.0Mproperty $1.5B
- #3Hawaii$7,632/persontotal $11.0Bincome $3.3Bsales $5.0Bcorporate $410.6M
- #4New Mexico$7,013/persontotal $14.9Bincome $2.5Bsales $4.5Bcorporate $782.0Mproperty $125.9M
- #5California$6,975/persontotal $275.0Bincome $128.7Bsales $53.5Bcorporate $39.4Bproperty $3.7B
- #6North Dakota$6,926/persontotal $5.5Bincome $425.4Msales $1.4Bcorporate $336.2Mproperty $6.0M
- #7Connecticut$6,736/persontotal $24.8Bincome $11.2Bsales $6.3Bcorporate $3.5B
- #8New York$6,608/persontotal $131.3Bincome $61.2Bsales $20.4Bcorporate $26.8B
- #9Delaware$6,607/persontotal $6.9Bincome $2.8Bcorporate $577.3M
- #10Massachusetts$6,470/persontotal $46.2Bincome $24.5Bsales $9.7Bcorporate $6.4Bproperty $17.8M
Top 10 lowest tax states
Least state tax collected per resident.
- #51Alaska$2,279/persontotal $1.7Bcorporate $365.4Mproperty $133.8M
- #50New Hampshire$2,393/persontotal $3.4Bincome $91.2Mcorporate $1.1Bproperty $413.6M
- #49Florida$2,719/persontotal $63.6Bsales $40.0Bcorporate $5.8B
- #48Texas$2,874/persontotal $89.9Bsales $56.5B
- #47Missouri$2,883/persontotal $18.0Bincome $7.8Bsales $5.4Bcorporate $1.6Bproperty $47.5M
- #46South Dakota$2,906/persontotal $2.7Bsales $1.7Bcorporate $59.9M
- #45Georgia$3,073/persontotal $34.4Bincome $16.2Bsales $9.3Bcorporate $3.3Bproperty $882.2M
- #44Oklahoma$3,185/persontotal $13.0Bincome $4.9Bsales $3.5Bcorporate $639.8M
- #43Ohio$3,269/persontotal $38.8Bincome $11.0Bsales $16.5Bcorporate $176,000
- #42Colorado$3,401/persontotal $20.3Bincome $8.8Bsales $4.7Bcorporate $2.4B
What it means for shoppers: High-sales-tax states add real money to every checkout, so coupon stacking and tax-free weekends matter more there. Low-tax states often lean on other fees instead — compare the landed price, not just the sticker.
Source: U.S. Census Bureau State Government Tax Collections plus Census population estimates (free public data, no API key). Last updated Mon, 14 Sep 2026 18:16:37 GMT. 9mallsAI.com is not affiliated with the Census Bureau; informational only.
US Labor Market Health
Official Bureau of Labor Statistics data — jobs, wages, openings, quits and inflation-adjusted pay. Paychecks drive how hard retailers have to discount.
Unemployment rate
4.1%
Share of the labor force actively looking for work (U-3, seasonally adjusted).
July 2026
Jobs added last month
-23k
Change in total nonfarm payroll employment — the headline jobs number.
July 2026
Job openings
7.4M
Open positions employers are actively trying to fill (JOLTS).
June 2026
Quits rate
2.0%
Share of workers voluntarily quitting — a direct read on job-market confidence.
June 2026
Average hourly pay
$37.62
Private-sector average hourly earnings for all employees.
July 2026
Labor force participation
61.4%
Share of adults working or actively looking for work.
July 2026
Employment-population ratio
58.9%
Share of the adult population that actually holds a job.
July 2026
Underemployment (U-6)
7.9%
Broadest jobless measure — includes part-time-for-economic-reasons and discouraged workers.
July 2026
Long-term unemployed
1.96M
People jobless 27 weeks or longer — the hardest part of the market to re-enter.
July 2026
Median job search
25.5 wks
How long the typical unemployed worker has been searching.
July 2026
Average weekly hours
34.3 hrs
Employers usually cut hours before they cut jobs, so this leads the cycle.
July 2026
Real (inflation-adjusted) pay
-0.4%
Pay growth minus CPI inflation — whether paychecks are actually gaining ground.
July 2026
What it means for shoppers: The job market is still tight, which keeps wages and consumer spending resilient — retailers discount less aggressively when shoppers feel secure.
Source: U.S. Bureau of Labor Statistics public API (CPS, CES, JOLTS and CPI series). Updated Wed, 12 Aug 2026 15:05:27 GMT.
Inflation & Consumer Prices (CPI)
Official BLS Consumer Price Index — 12-month price changes for groceries, gas, rent, clothing, cars and more, plus wholesale producer prices.
Headline inflation (CPI-U)
+3.5%
All items, 12-month change — the number the news calls 'inflation'.
July 2026
Core inflation (ex food & energy)
+2.7%
Strips out volatile food and gas — the underlying trend the Fed watches.
July 2026
Food prices
+3.1%
All food, at home and away from home.
July 2026
Groceries (food at home)
+2.8%
Supermarket prices — the fastest way inflation shows up in a weekly budget.
July 2026
Restaurants (food away from home)
+3.7%
Dining out, takeout and delivery menu prices.
July 2026
Energy
+14.4%
Gasoline, electricity, natural gas and heating fuels combined.
July 2026
Gasoline
+24.6%
Pump prices — swings here move the headline number more than anything else.
July 2026
Electricity
+4.0%
Residential power bills.
July 2026
Shelter
+3.4%
Rent and owners' equivalent rent — the single biggest slice of the CPI basket.
July 2026
Rent of primary residence
+3.1%
What renters actually pay, on average, nationwide.
July 2026
Apparel
+2.6%
Clothing and footwear — the category most often discounted below trend.
July 2026
New vehicles
+0.5%
Transaction prices for new cars and trucks.
July 2026
Used cars & trucks
-1.9%
Used-vehicle prices, historically the most volatile big-ticket line.
July 2026
Household furnishings
+2.5%
Furniture, appliances, bedding and home goods.
July 2026
Medical care
+2.2%
Doctors, hospitals, insurance and prescriptions.
July 2026
Transportation services
+2.7%
Airfare, car insurance, repairs and public transit.
July 2026
Producer prices (final demand)
+5.5%
What producers charge — usually leads consumer prices by a few months.
June 2026
What $100 buys vs 2 years ago
$94.09
Cumulative loss of purchasing power in the same basket of goods and services.
July 2026
What it means for shoppers: Prices are still climbing faster than normal. Stacking coupons and shopping promotions is doing real work against your budget right now.
Source: U.S. Bureau of Labor Statistics public API (CPI-U and PPI series). Percent changes are 12-month unless noted. Updated Wed, 12 Aug 2026 15:05:28 GMT.
Powered by Kalshi Research. Data provided by Kalshi's public free market data API. 9mallsAI.com is not affiliated with Kalshi; this page is for informational purposes only.